Analytics
Frame provides a variety of reports to see exact usage and analytics about your tenant. Navigate to the “Analytics” panel in your Dashboard to see detailed information about your users' sessions, usage, disk usage, and elasticity at the account level. Each of these reports can be downloaded using the Download CSV button in the upper right corner of the panel.
Customer Administrators can see the analytics data for all organizations and accounts associated with the tenant by navigating to the Customer or Organization Dashboard from the initial Admin Console view and clicking Analytics.
Sessions
The “Sessions” tab is the first page displayed on the Analytics page of your Dashboard. This page shows a plot of the number of sessions per hour, day, or month during a given time interval. Use the drop down menus on this tab to display the information by frequency, system, and time period. This example shows the number of production sessions launched within a month.
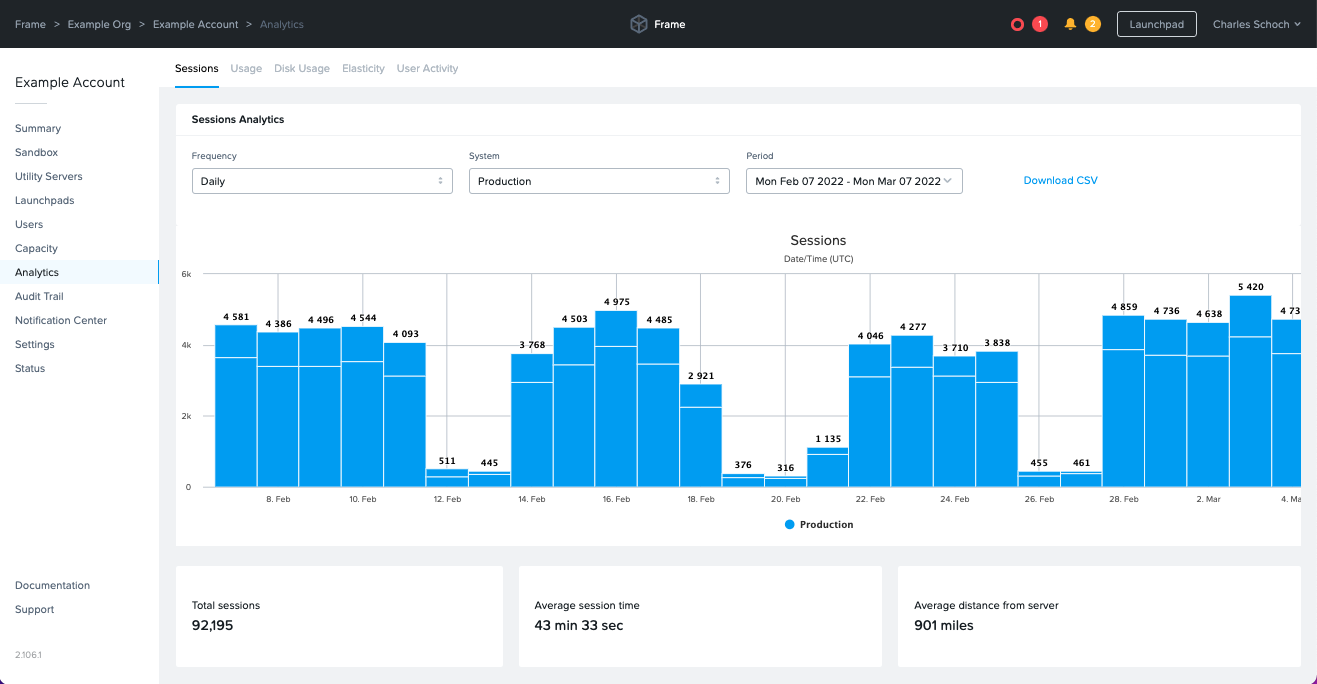
You can also see the total sessions, average session time, and average distance from the datacenter displayed below the graph.
More detailed information is displayed when hovering over a bar on the graph.
In this example, we can see there were 3,539 total production instances on February 10th, 2022.
Usage
The “Usage” tab is the next tab over on the Analytics page. “Usage” provides detailed information about the hourly usage consumed per specified frequency, system, pool, and time interval.
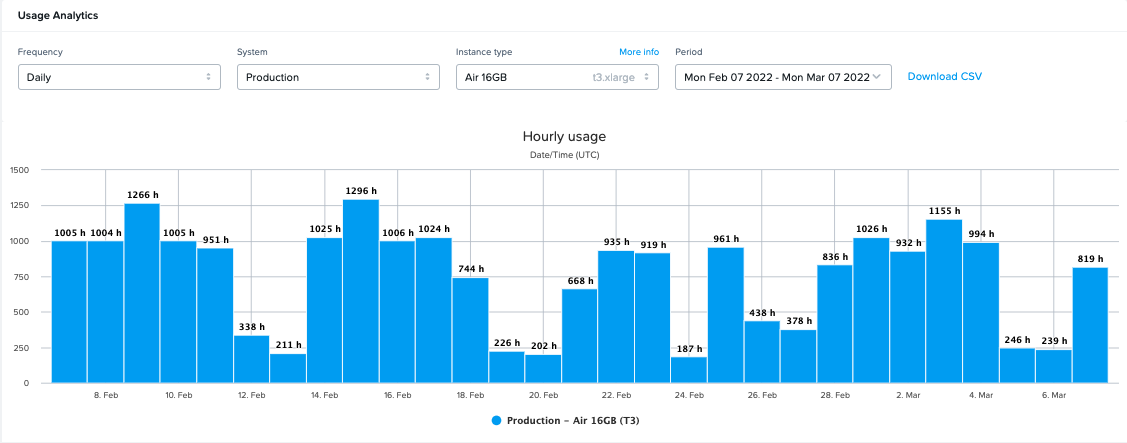
The hourly usage is broken up by system type, with a key for each system type displayed below. Toggle which system types are displayed on the graph by clicking on them or changing the “Pool” from the drop down menu. In the example below, we have disabled the production Air 16GB system type.
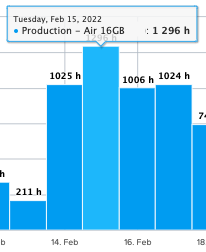
The total hours used will always be displayed on the bottom left side of the graph on this page.
Disk Usage
The “Disk Usage” tab displays the amount of disk volume usage (in GB) within a specific period of time. You can adjust the frequency (hourly, daily, or monthly) using the drop down menu above the graph.
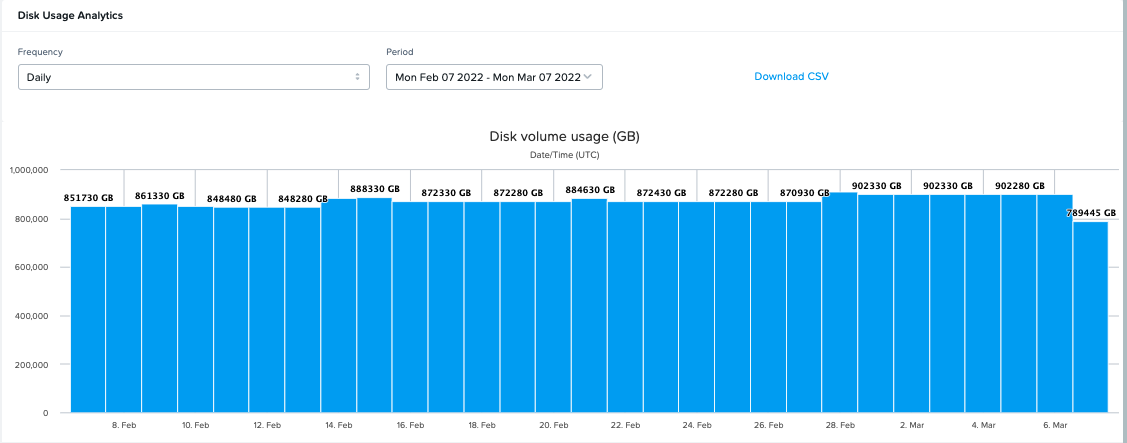
More detailed information is displayed when hovering over a bar on the graph.
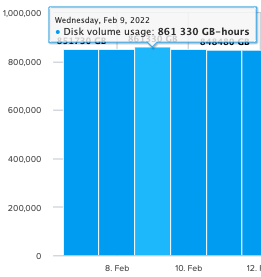
The total disk volume usage (in GB hours) will always be displayed in the bottom left corner below the graph.
User Activity
The "User Activity" tab lists the users who have logged into Frame Console by their first and last name, identity provider, identity provider-provided email address, and the date/time the user was successfully logged into Frame. Use the dropdown menus on this tab to specify the date range of the User Activity report. The User Activity report also summarizes the total number of successful user logins and unique users (identity provider and email address) within the specified date range.
Elasticity
The Elasticity tab provides additional detail for evaluating the performance of your capacity settings (min, max, and buffer). The most important part of this chart lets you compare the active sessions (represents users that are connecting) to active instances (the number of systems that are powered on and are consuming usage hours). For example, if you find that your active instances are always much higher than your active sessions, then you should consider lowering your “min” and “buffer” settings. Additionally, you can use this graph to ensure your Default Capacity max is not too high relative to the peak active sessions.
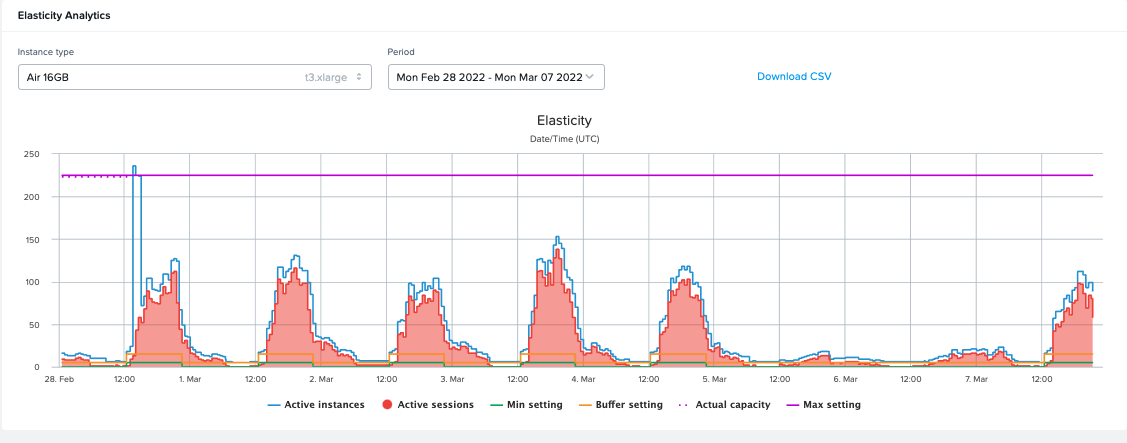
More detailed information is displayed when hovering over a point on the graph.
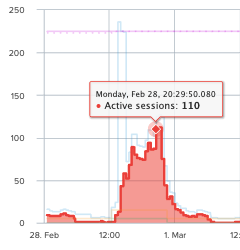
Individual measures can be enabled and disabled by clicking the text descriptor for the measures.

The measures are defined as:
- Active Instances: Active Instances are instances which are powered on.
- Active Sessions: An Active Session is an active instance with a connected user.
- Min setting: The minimum number of instances powered on at a given time that can be accessed by users immediately.
- Buffer setting: Additional powered-on instances that are ready for a user within seconds. Set this to a number of users you expect will connect within a 2-minute window of time (the time it takes to boot an instance).
- Actual capacity: The total number of instances, active or otherwise, that could be provisioned.
- Max setting: The desired number of instances (concurrent users) to be provisioned for the pool. The administrator should determine this number based on peak session concurrency since this is a hard limit.
CSV Download
When downloading the Elasticity report values as a CSV file, Frame Console adds two additional variables to the CSV file:
- Pool Kind:
productionto indicate that the values are for a production pool and a blank value to indicate that the values are for a test pool. - Time: Specifies the date/time (in UTC) for the change in value for one or more measures.
Session Reports
The session reports feature allows administrators to download and view session activity logs as .CSV files for more detailed user tracking and session troubleshooting. This section outlines how to enable and interpret session reports.
Enable Session Reports
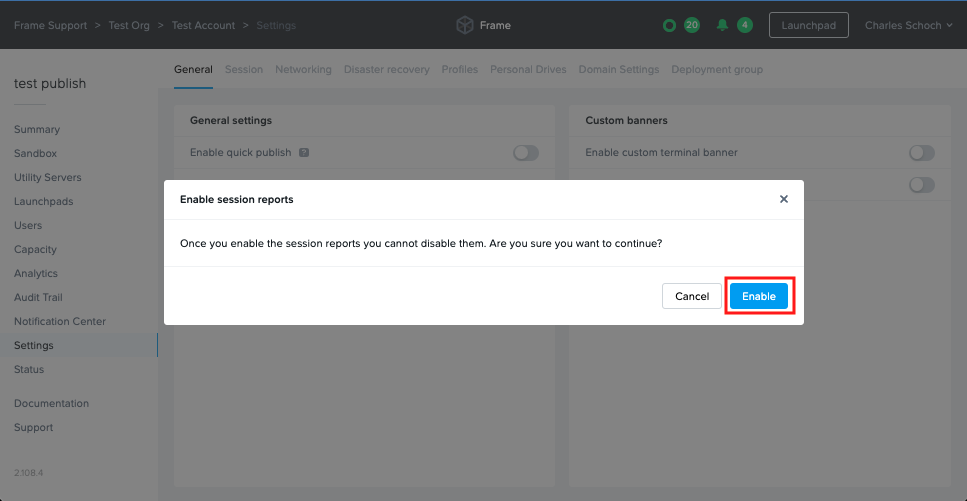
To enable session reports, navigate to the Settings tab of the Nutanix Console and click the “session reports generation” option.
Once enabled, sesson report generation cannot be disabled.
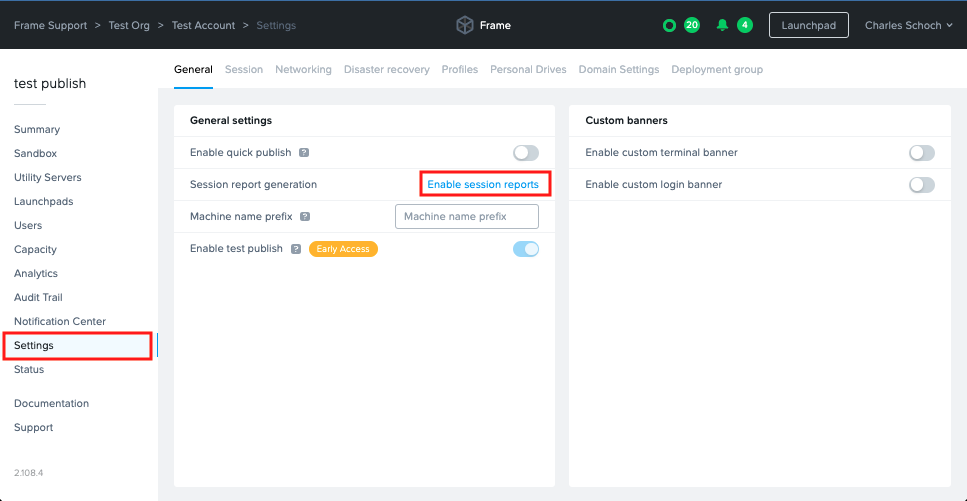
A prompt will open formally notifying you that these changes cannot be reversed. Click Accept.
Navigate to the Analytics tab of the Nutanix Console and select the session reports tab.
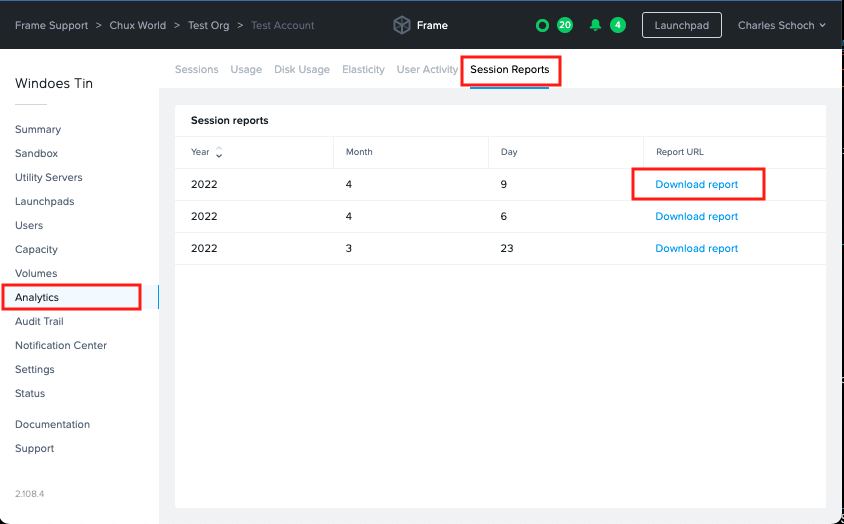
In order to download a specific report, simply click the corresponding “Download report” link and save the file to your local computer.
Once enabled, session reports take approximately 24 hours to be made available for download from the Frame Dashboard.
Session Report Definition
The session report consist of a .CSV file which can be imported into the application of your choice for compiling into an itemized list with log activity of all sessions from the reports date range. This information consists of:
| Name | Description |
|---|---|
| Username | The user ID associated with the session. |
| Name | The user's name on record. |
| The email address associated with the user of the session. | |
| Geo_Distance | An estimate of the geographic distance between the user's location and the datacenter accessed, measured in miles. |
| City | The name of the city the user accessed their session from, as indicated by IP address. |
| Started_At | UTC Time and date the session was started. |
| Time_To_Start | Elapsed time from an instance being requested to the session beginning, measured in seconds. |
| Session_Duration | Duration of the session, measured in seconds. |
| State | Whether the session is open or closed, at time of report generation. |
| Remote_IP | The IP address utilized by the session user. |
| System_Type | The type of instance utilized for the session. |
| Session_Type | The type of instance used during the session. IE: Sandbox, Utility Server, Production Instance, Persistent Desktop. |
| User_Data | Lists any custom data passed to the user's session via a userData object property. |
| Account_ID | The Frame Vendor ID. |
| Account_Name | Name of the Frame account accessed. |
| API_Account_ID | Not user serviceable at this time. |
| Region | The region of the cloud account. |
| Country | The country of the cloud account. |
| Session_ID | The session ID. |
| Storage_Used | Lists any attached personal cloud storage such as Google Drive or Dropbox. |